
New Jersey Radon Potential
- Thread starter dogg57
- Start date
You are using an out of date browser. It may not display this or other websites correctly.
You should upgrade or use an alternative browser.
You should upgrade or use an alternative browser.
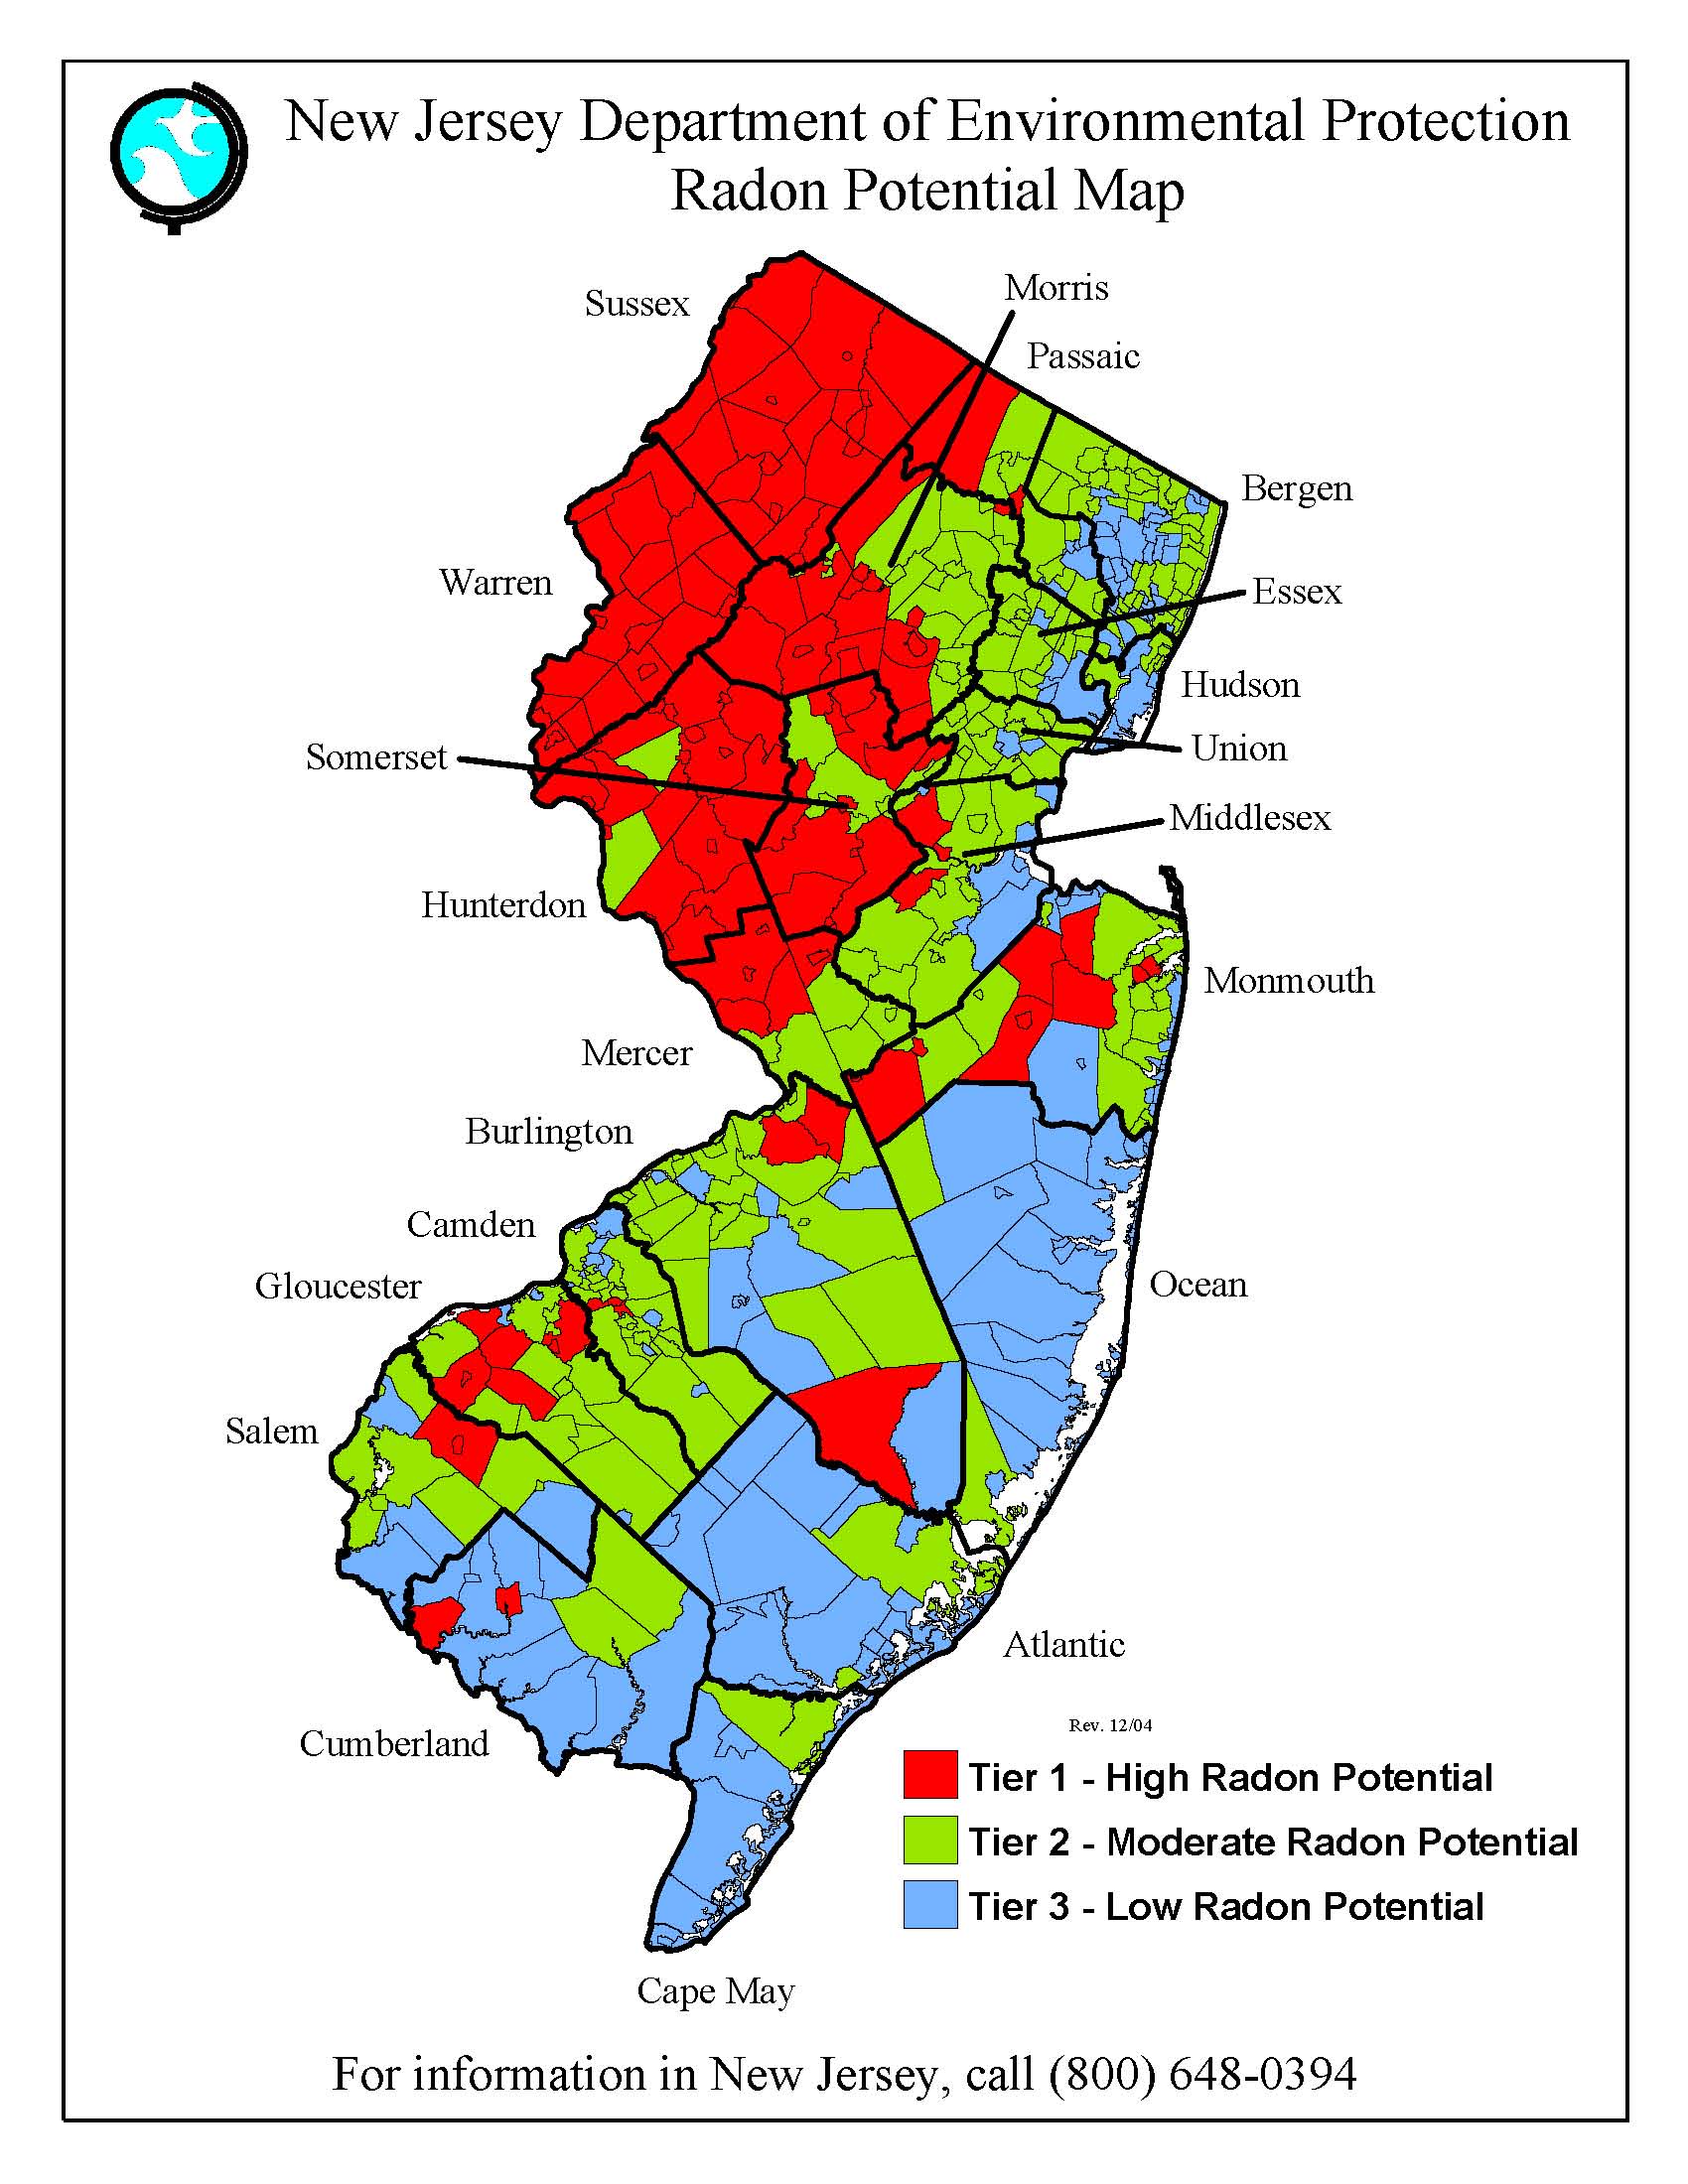
After buying and selling a few houses, I've been told that there isn't much worry about radon in sandy soils. That red zone in Southern Burlington County is interesting.
I don't even have a basement now. But my old farmhouse in NY had a unfinished basement with the old stone walls that don't even have mortar. Those are supposed to be the worst kind when it comes to radon.
I don't even have a basement now. But my old farmhouse in NY had a unfinished basement with the old stone walls that don't even have mortar. Those are supposed to be the worst kind when it comes to radon.
Comment, a pet peeve. Just like the definition of the Pinelands, the delineation of areas inhabited by plants and animals by various "authorities", the borders of Tier 1, 2, and 3, are here defined by political boundaries, NOT by the presence or absence of the item in any given spot under discussion. This kind of cartography can provide very misleading information. Maybe that red south Burlington township is actually only one reading at one spot?
To me it appears a geologic problem. The older the underlying bedrock, the more radiogenic it is. South Jersey landscapes that are perched atop old relict plateau are hotter spots. When I do luminescence (radiometric) dating of Pine Barrens soils, I am careful not to collect soil samples near gravels because their natural internal radioactivity screws up my dates. At $1500 per sample that's not a good thing. Much of the ancient land is buried by newer sediments, so you would never know it was there. Maybe that buried land's radioactivity still ghosts upward. It would be interesting to test the hypothesis.
"defined by political boundaries"
I have the same peeve. I see it often with weather warnings with them zigzagging all over a state. I find them annoying and pretty much useless like the map above. It states the obvious in the north and the rest has been proven here to be confounding, but then it came from the NJDEP.
I have the same peeve. I see it often with weather warnings with them zigzagging all over a state. I find them annoying and pretty much useless like the map above. It states the obvious in the north and the rest has been proven here to be confounding, but then it came from the NJDEP.
Well I'll play the devil's advocate here... You need to understand the purpose of any graphic like the one above, and that requires the use of both your eyes and brain. If you take the simplistic view that "if I move 200 yards South, then I don't have to worry about radon", then there are probably a lot of other things in life that you also misinterpret.
They have apparently taken the results of radon tests, sorted them by township and then colored a map based on the average results. Now I would agree there are probably better ways to present radon test data. Showing individual test results as points would give a clearer picture, but it might be a mess to present in a small graphic. But flawed though it might be, it could still be a useful tool, telling you that others in your area have reported high radon levels and encouraging you to get your home tested.
They have apparently taken the results of radon tests, sorted them by township and then colored a map based on the average results. Now I would agree there are probably better ways to present radon test data. Showing individual test results as points would give a clearer picture, but it might be a mess to present in a small graphic. But flawed though it might be, it could still be a useful tool, telling you that others in your area have reported high radon levels and encouraging you to get your home tested.
