Interesting Gabe. On the regular aerial, are there any roads or trails leading to it? Is that the edge of a hard road I see in the upper left corner?

2019 South Jersey LIDAR
- Thread starter Boyd
- Start date
You are using an out of date browser. It may not display this or other websites correctly.
You should upgrade or use an alternative browser.
You should upgrade or use an alternative browser.
- Status
- Not open for further replies.
Reminds me of this, but probably smaller?
https://boydsmaps.com/#17/39.85206/-74.30787/lidarHD
I mentioned it in the sand pit thread, but this was the original:
 forums.njpinebarrens.com
https://boydsmaps.com/#17/39.85206/-74.30787/lidarHD
I mentioned it in the sand pit thread, but this was the original:
Something odd between Aserdaten and Forked River Mountain
Am working on a new map that fuses NJ 2012 aerials with LIDAR imagery and just noticed this. Possible alien saucer landing site?... Look at the regular aerial orthophoto... nothing to see here. Now look closely at the middle of the LIDAR enhanced image.... Here's an extreme closeup. In...
Last edited:

Reminds me of this, but probably smaller?
https://online.boydsmaps.com/#17/39.85206/-74.30787/lidarHD
I mentioned it in the sand pit thread, but this was the original:
Something odd between Aserdaten and Forked River Mountain
Am working on a new map that fuses NJ 2012 aerials with LIDAR imagery and just noticed this. Possible alien saucer landing site?... Look at the regular aerial orthophoto... nothing to see here. Now look closely at the middle of the LIDAR enhanced image.... Here's an extreme closeup. In...
Did you ever figure out what that is?
It's strange to me that the 2019 lidar is so much more detailed than the lidar found in boydsmaps, yet things show up in the latter that don't show up in the former. Why is that?
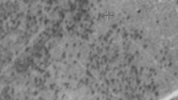
Interesting Gabe. On the regular aerial, are there any roads or trails leading to it? Is that the edge of a hard road I see in the upper left corner?
Bob, that's a dirt road you see. Here's the 1931 aerial. Notice the path going right through the center of the feature (the feature is where the target is).
Attachments
The 2015 1-meter LIDAR only covers Camden, Burlington and Gloucester Counties. My old map used the older 3-meter (1/9 arc-second) LIDAR for all the areas that are covered by this new 2019 LIDAR. That is a huge difference in resolution. Imagine a little shed that is 10 feet x 10 feet. It would be represented by one pixel on the 2015 LIDAR. There would be 9 pixels representing the same shed on the 2019 LIDAR - quite a difference when looking for details.
The 2015 1-meter LIDAR only covers Camden, Burlington and Gloucester Counties. My old map used the older 3-meter (1/9 arc-second) LIDAR for all the areas that are covered by this new 2019 LIDAR. That is a huge difference in resolution. Imagine a little shed that is 10 feet x 10 feet. It would be represented by one pixel on the 2015 LIDAR. There would be 9 pixels representing the same shed on the 2019 LIDAR - quite a difference when looking for details.
Right, but why is it that certain trails show up on the lower resolution lidar but not on the higher reolution images?
...And I should also add that the 2019 LIDAR actually has a resolution of 2 feet per pixel, so my earlier example was too conservative - it would be more like 25 pixels representing the 10 ft shed. However, I have down-sampled it to 1-meter to match the 2015 LIDAR and to keep the size of my new map reasonable.
Surprise!... LIDAR in the Pines 2021 (Monochrome Edition) is now available 
I'll still be releasing another map with roads, waterbodies, etc but this was pretty straightforward when I finally finished preparing all the elevation data. It's rendered in a style similar to the NJGIN map, but I tried to bring out more detail by using more vertical exaggeration, a lower light angle and less intense highlight.
NJGIN (old) Version

Boyd's (new) Version

The map consists of 1-meter (or better) resolution LIDAR DEM for everything South of I-195 plus parts of PA and DE bordering the Delaware River. This combines my existing data from LIDAR in the Pines HD, the new South NJ 2019 LIDAR and I also downloaded quite a bit of additional USGS 3DEP LIDAR to fill in all the missing puzzle-pieces.
Although the mobile site is optimized for smaller touchscreens, it works fine on computers. You might reduce the size of your browser window for a better experience. Use the right mouse button to tilt and rotate the map in 3d, you can return to standard north-up view by clicking the compass. To link to a specific map view, press the menu button and choose Export.

I have not decided whether to put this map on the desktop site, which is basically frozen until I complete the mobile site. At that point, the desktop app will be completely updated to use the same 3d Maptalks API and my custom code.
Note: I'll be shutting down the 2019 LIDAR Viewer site that was temporarily created since you can now fully access these maps.
I'll still be releasing another map with roads, waterbodies, etc but this was pretty straightforward when I finally finished preparing all the elevation data. It's rendered in a style similar to the NJGIN map, but I tried to bring out more detail by using more vertical exaggeration, a lower light angle and less intense highlight.
NJGIN (old) Version
Boyd's (new) Version
The map consists of 1-meter (or better) resolution LIDAR DEM for everything South of I-195 plus parts of PA and DE bordering the Delaware River. This combines my existing data from LIDAR in the Pines HD, the new South NJ 2019 LIDAR and I also downloaded quite a bit of additional USGS 3DEP LIDAR to fill in all the missing puzzle-pieces.
Although the mobile site is optimized for smaller touchscreens, it works fine on computers. You might reduce the size of your browser window for a better experience. Use the right mouse button to tilt and rotate the map in 3d, you can return to standard north-up view by clicking the compass. To link to a specific map view, press the menu button and choose Export.
I have not decided whether to put this map on the desktop site, which is basically frozen until I complete the mobile site. At that point, the desktop app will be completely updated to use the same 3d Maptalks API and my custom code.
Note: I'll be shutting down the 2019 LIDAR Viewer site that was temporarily created since you can now fully access these maps.
Last edited:
Super-dooper. Thanks Boyd.
Incredible!Surprise!... LIDAR in the Pines 2021 (Monochrome Edition) is now available at mobile.boydsmaps.com
I'll still be releasing another map with roads, waterbodies, etc but this was pretty straightforward when I finally finished preparing all the elevation data. It's rendered in a style similar to the NJGIN map, but I tried to bring out more detail by using more vertical exaggeration, a lower light angle and less intense highlight.
NJGIN (old) Version
View attachment 14945
Boyd's (new) Version
View attachment 14946
The map consists of 1-meter (or better) resolution LIDAR DEM for everything South of I-195 plus parts of PA and DE bordering the Delaware River. This combines my existing data from LIDAR in the Pines HD, the new South NJ 2019 LIDAR and I also downloaded quite a bit of additional USGS 3DEP LIDAR to fill in all the missing puzzle-pieces.
Although the mobile site is optimized for smaller touchscreens, it works fine on computers. You might reduce the size of your browser window for a better experience. Use the right mouse button to tilt and rotate the map in 3d, you can return to standard north-up view by clicking the compass. To link to a specific map view, press the menu button and choose Export.
View attachment 14944
I have not decided whether to put this map on the desktop site, which is basically frozen until I complete the mobile site. At that point, the desktop app will be completely updated to use the same 3d Maptalks API and my custom code.
Note: I'll be shutting down the 2019 LIDAR Viewer site that was temporarily created since you can now fully access these maps.
")
Al,Thanks again Boyd! especially for putting coords to it. Makes locating tar kilns much easier then trying to match different aerials which works but takes a bit of time and head banging in areas where there are no notable trees or tree patterns.
The Hillshade Lidar site allows you to get coordinates. Just click on "Measure" and then click on the square icon next to the ruler. Once you click on the map at any location the coordinates show up. You can also change it to DMS.
Thanks Guy! Will simplify my Kiln Quest greatly!Al,
The Hillshade Lidar site allows you to get coordinates. Just click on "Measure" and then click on the square icon next to the ruler. Once you click on the map at any location the coordinates show up. You can also change it to DMS.
I have noticed an odd thing.This island https://online.boydsmaps.com/#17/39.43177/-75.06823/njgin2007 seems to be impervious to Lidar.It is not on any of the Lidar imagery but yet I have stood on it.
Nothing impervious there Al, just another example of hydro flattening. When the imagery is processed they use the boundaries of the waterbody (not sure of the source) and set the elevation of everything inside to the mean elevation of the water. In this case, that island obviously wasn't included in their data. Maybe it was an oversight or was just too small?
I used 2012 landcover data for the waterbodies in my 2020 map and that island is shown.
https://boydsmaps.com/#17/39.43177/-75.06823/pines2020
Note quite true, it shows on my new LIDAR 2021 HD map which uses that same waterbody data.
https://boydsmaps.com/#17.00/39.431770/-75.068230/lidar2021hd/0.00/0.00
But the green color of the island is actually the flat surface of the water, so technically, it doesn't show on the LIDAR. You can also see where my waterbody data doesn't quite match the LIDAR in the islands/shoreline north of there too.
I used 2012 landcover data for the waterbodies in my 2020 map and that island is shown.
https://boydsmaps.com/#17/39.43177/-75.06823/pines2020
It is not on any of the Lidar imagery but yet I have stood on it.
Note quite true, it shows on my new LIDAR 2021 HD map which uses that same waterbody data.
https://boydsmaps.com/#17.00/39.431770/-75.068230/lidar2021hd/0.00/0.00
But the green color of the island is actually the flat surface of the water, so technically, it doesn't show on the LIDAR. You can also see where my waterbody data doesn't quite match the LIDAR in the islands/shoreline north of there too.
Last edited:
That island is all of three ft above lake level in the center and so thick you can barely get onto it.You can actually walk across the top of the lake from there across Old Colonial Dam which is the original dam in the lake from the 1700's.In the summer a rim of grass grows on the dam and it can be seen thta way but in winter you don't see it till your floating across it.It;s maybe four or five inches below water and the two spill ways at each end are several ft deep.The one near the is;land being deeper at about chest deep.Nothing impervious there Al, just another example of hydro flattening. When the imagery is processed they use the boundaries of the waterbody (not sure of the source) and set the elevation of everything inside to the mean elevation of the water. In this case, that island obviously wasn't included in their data. Maybe it was an oversight or was just too small?
I used 2012 landcover data for the waterbodies in my 2020 map and that island is shown.
https://online.boydsmaps.com/#17/39.43177/-75.06823/pines2020
Note quite true, it shows on my new LIDAR 2021 HD map which uses that same waterbody data.
https://mobile.boydsmaps.com/#17.00/39.431770/-75.068230/lidar2021hd/0.00/0.00
But the green color of the island is actually the flat surface of the water, so technically, it doesn't show on the LIDAR. You can also see where my waterbody data doesn't quite match the LIDAR in the islands/shoreline north of there too.
Regardless, for some reason they "flattened" it. The full point cloud dataset would include everything, flattening is part of the bare-earth specification which I posted earlier.
- Status
- Not open for further replies.